All connections logic — at a glance
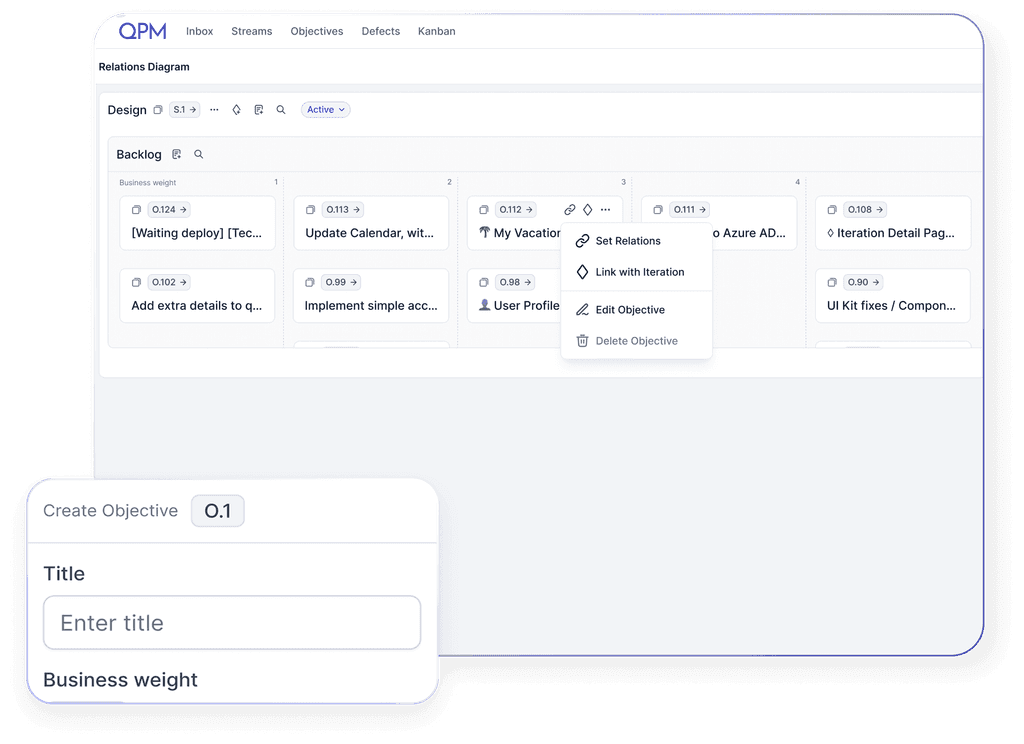
The Relations Diagram in QPM visualizes dependencies between tasks, streams, and iterations.
You immediately see what needs to be implemented, which tasks are interconnected, how iterations affect each other, where there are potential risks of delays, and at which points adjustments should be made to ensure steady progress toward goals.
It’s an ideal tool for strategic planning, team synchronization, and managing the backlog.


Who benefits from Relations Diagram?
Project Managers and Team Leads
To build a clear project structure, set priorities, and identify dependencies between tasks and teams.
Product Managers and Product Owners
To see the complete picture of goal implementation, manage dependencies between features, understand relationships between iterations, and avoid blockers.
Operational and Strategic Directors
To assess the effectiveness of team collaboration and track strategic progress.
Business Analysts
To analyze cross-functional processes, identify bottlenecks, and build a compelling logic for goal implementation.
Cross-department Teams
For joint planning of tasks that depend on data, decisions, or actions from other teams.
QA / Test Leads
Integrate review stages, test planning, and bug-related delays directly into the autoplanning process for seamless quality management.
Main functions of the Relations Diagram in QPM
The Relations Diagram allows you to quickly create iterations (sprints) and objectives (epics), build dependencies between them, and set priorities — without the need to dive into the details of each project. This saves managers’ time and helps maintain focus on a strategic level.
Learn more about QPM

How the Relations Diagram works in QPM
The user creates a stream or an iteration, which can represent a business goal, product, project, or team initiative.

Why use the Relations Diagram in QPM
Transparency at all levels

Improved planning

Preventing blockages and delays

Synchronization between departments

Backlog optimization

